
How to Trade Stocks Using Elliott Wave Theory
Elliott Wave Theory is more than just a charting method—it’s a way to read market psychology through wave patterns. When applied properly, it helps stock traders identify trend direction, correction phases, and entry/exit points with high confidence.
In this guide, we’ll walk through how to trade stocks using Elliott Wave Theory step-by-step.
Step 1: Identify the Larger Trend
Start by analyzing the higher timeframe chart (weekly or daily). Look for:
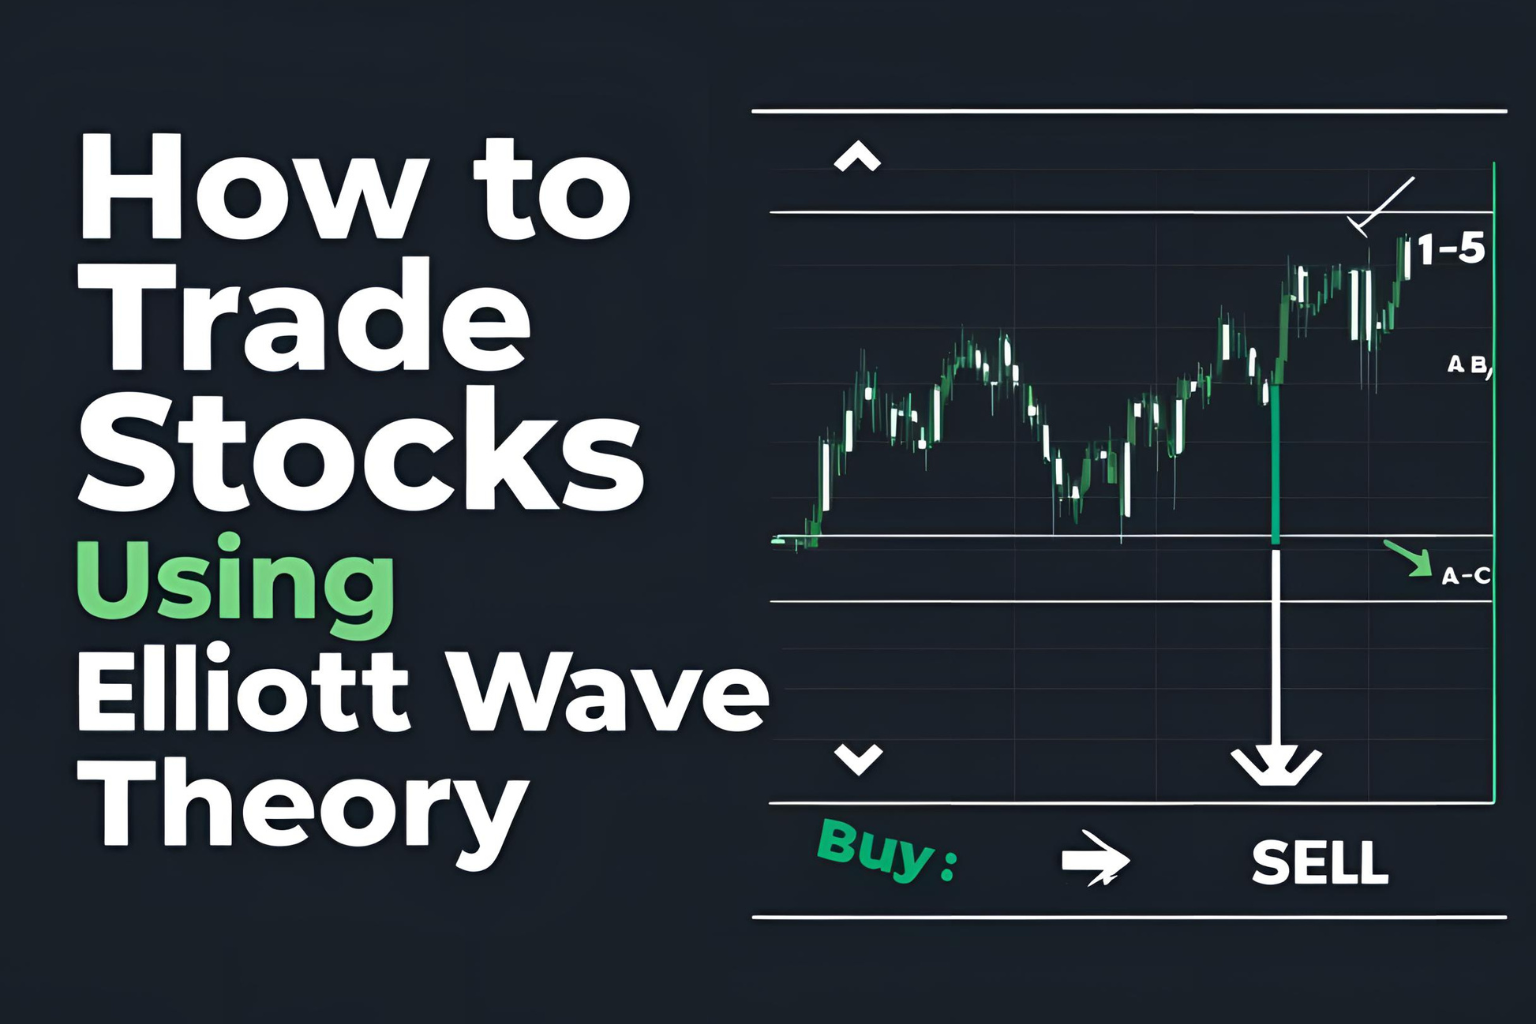
- A clear 5-wave impulse structure (indicating trend direction)
- A completed ABC correction (indicating a potential trend restart)
- Wave labels like 1-2-3-4-5 or A-B-C
This will guide your lower timeframe trading and help avoid going against the main trend.
Step 2: Label the Waves Properly
Use the Elliott Wave rules to count and label each wave:
- Wave 1: Start of the move
- Wave 2: Pullback (but not beyond the start)
- Wave 3: Strongest move
- Wave 4: Consolidation (no overlap with Wave 1)
- Wave 5: Final push before a correction
Tip: Always validate your wave count using the three core rules and alternate scenarios.
Step 3: Enter on Wave 3 or Wave C
Waves 3 and C usually offer the highest momentum and lowest risk trades.
- For bullish setups: Enter at the start of Wave 3
- For bearish setups: Enter at the start of Wave C after a failed Wave B rally
Look for confirmation using:
- Breakouts from consolidation
- RSI/MACD momentum shift
- Fibonacci retracement zones
Step 4: Use Fibonacci Tools for Targets
Elliott Wave trading works best with Fibonacci retracement and extension levels:
- Wave 2 often retraces 50%–61.8% of Wave 1
- Wave 3 often targets 161.8% extension of Wave 1
- Wave C often equals Wave A in length (or 1.618×)
These levels provide realistic profit targets and stop-loss zones.
Step 5: Manage Risk and Set Stops
Place stop-losses:
- Below the start of Wave 1 (in bullish trades)
- Above the start of Wave A (in bearish trades)
Keep risk per trade small, as wave counts can be subjective and prone to revisions.
Practical Example: Trading a Stock Setup
Let’s say you spot a potential Wave 2 pullback in a strong uptrend on Apple stock.
- You label Wave 1 (upward move), then Wave 2 (downward retracement)
- Wait for a breakout to confirm start of Wave 3
- Enter the trade, target 161.8% extension, place stop below Wave 2 low
This structured approach reduces emotional trading and improves consistency.
Conclusion
Trading stocks with Elliott Wave Theory allows you to analyze market behavior through patterns—not guesswork. By understanding wave structure, using Fibonacci tools, and focusing on key waves like 3 and C, you can time your trades more accurately.
Like any strategy, it requires practice—but once mastered, it can offer a powerful edge.
FAQs
Is Elliott Wave Theory good for trading individual stocks?
Yes, especially liquid stocks that follow technical trends.
Which waves are best to trade?
Wave 3 and Wave C typically offer the strongest moves with good risk-reward setups.
Can beginners use Elliott Wave Theory?
Yes, but start with simple impulse and corrective patterns before using it in real-time trading.
Do I need expensive tools to trade with Elliott Wave?
No. Basic charting platforms like TradingView are sufficient.
How do I improve my wave labeling accuracy?
Study historical charts, follow Elliott Wave rules, and validate with other indicators.


