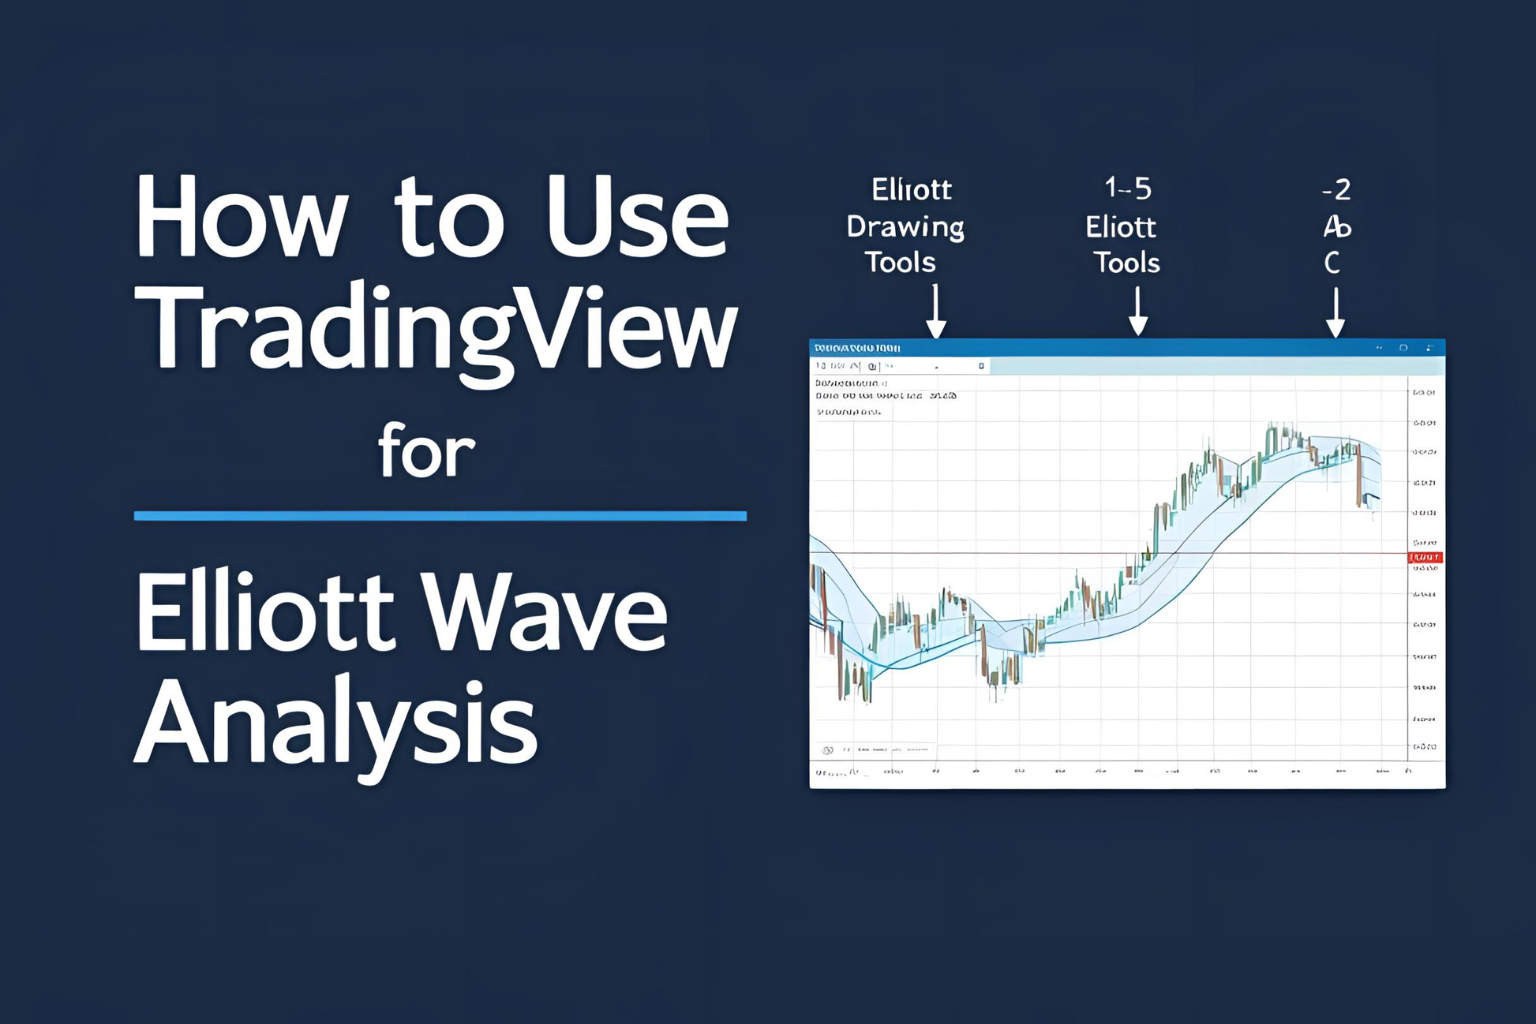
How to Use TradingView for Elliott Wave Analysis
TradingView is one of the most popular charting platforms in the world. With built-in drawing tools and community indicators, it’s ideal for performing Elliott Wave analysis, especially for traders who want speed, accessibility, and ease of use.
In this guide, we’ll walk through how to use TradingView effectively to chart and analyze Elliott Waves.
Why Use TradingView for Elliott Wave?
- Web-based and mobile accessible
- Includes manual Elliott Wave drawing tool
- Easy integration of Fibonacci tools
- Large trader community and published wave ideas
- Works for stocks, crypto, forex, and indices
Step 1: Access the Elliott Wave Tools
- Open a chart on TradingView (any asset or timeframe).
- In the left-side toolbar, click on the ‘Wave’ icon (labeled as “Elliott Wave”).
- Choose from:
- Elliott Impulse Wave (12345)
- Elliott Correction Wave (ABC)
These tools allow you to manually label wave patterns by clicking five or three points directly on your chart.
Step 2: Draw a 5-Wave Impulse
To label a basic uptrend:
- Click the Elliott Impulse Wave tool
- Start at the beginning of Wave 1
- Continue clicking to mark Waves 2 through 5
- Double-click to finalize the wave structure
You can then adjust wave points by dragging them into position.
Step 3: Add an ABC Correction
Follow the same process using the Elliott ABC Correction tool. This is helpful for labeling pullbacks after a 5-wave impulse or during sideways markets.
Use it after Wave 5 to forecast an upcoming A-B-C move.
Step 4: Apply Fibonacci for Accuracy
Use Fibonacci Retracement or Extension tools to:
- Measure Wave 2 and Wave 4 pullbacks
- Project Wave 3 and Wave 5 targets
- Identify Wave C extension possibilities
These tools are located under the same drawing toolbar and can be adjusted to any two price points on the chart.
Step 5: Use Indicators to Confirm Waves
Combine Elliott Wave patterns with:
- Volume: Increases during Wave 3, fades in Wave 5
- RSI/MACD: Look for divergences in Wave 5
- Trendlines: Helpful for identifying diagonals or triangles
Step 6: Save and Share Your Analysis
TradingView lets you:
- Publish your wave analysis to the community
- Save templates for reuse
- Set alerts based on price levels or indicator conditions
Use this to track how your Elliott Wave count plays out in real time.
Common Mistakes to Avoid
- Mislabeling corrective patterns
- Skipping wave rules (e.g., overlap between Waves 1 and 4)
- Ignoring higher timeframe context
- Not validating waves with indicators
Always cross-check wave counts for structure and proportion.
Conclusion
TradingView offers everything you need to perform manual Elliott Wave analysis—even as a beginner. With simple wave tools, Fibonacci drawing capabilities, and community ideas, it’s one of the most accessible platforms to master wave theory.
Start with clear trends, draw simple waves, and refine your skills with each chart you label.
FAQs
Is TradingView free for Elliott Wave analysis?
Yes, the basic drawing tools are available in the free version.
Can I use Elliott Wave indicators in TradingView?
Yes, many community scripts automate wave counting or pattern detection.
Does TradingView auto-label Elliott Waves?
No, wave labeling is manual unless you use a custom script.
Can I do wave analysis on mobile?
Yes, TradingView’s mobile app supports drawing tools and full chart access.
How accurate is Elliott Wave analysis on TradingView?
Accuracy depends on your experience, but TradingView provides the tools to do it well.


